Archive - Originally posted on "The Horse's Mouth" - 2012-02-11 10:18:48 - Graham Ellis
When you're planning to write an application, you shouldn't just start writing code - you should think about what you're going to do and plan ahead. But how do you plan ahead? How do you ensure that you've thought of things from various angles?
UML (Unified Modeling Language) is a way of drawing (modeling) a system through a series of diagrams of different types - there are 7 basic types - and there are various software packages that can help you. But to go the whole hog and use them all on a small system is overkill, and on courses I often suggest to delegates it's far more practical to think things through and to know that you could draw the diagrams, rather than to draw them all with all the formally designated shapes and symbols. For an application I specified and started to write yesterday, I drew some example diagrams, which I'll share with you here.
The application requirement is to analyse a day's web server log files and extract information from them about the types and lengths of visits (a typically woolly or fluffy initial spec). Let's draw some diagrams ...
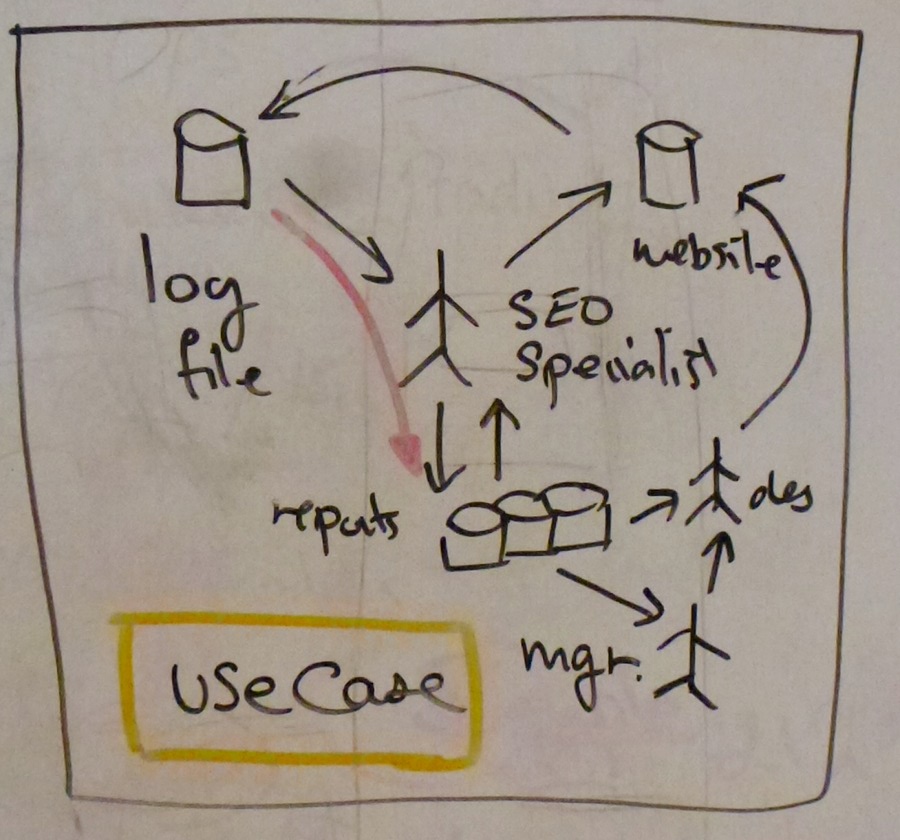
The Use Case diagram. "Where does the data come from, where does it go, and who provides it / who requires the answers". Where "who" is a job role, rather than an individual's name. The application that I started to write is indicated by the red arrow - taking the log files and providing a management / decision helping report.
The Object diagrams. For each of the data types (objects), we're defining what they contain - what other objects, how many of them, etc. In this example, we're defining a "visit" as containing one or more "requests". Each visit will contain one "browser" object and one "ip" object.
Class diagrams. Where data types have subclasses / other subsidiary types, you'll need to work out your inheritance tree. In this example, website access requests within a visit are divided into "request" objects which are specifically requested by a visiting user, and "require" objects which are called up within a page by a request - that's accesses for things like style sheets and embedded images.
Sequence diagrams. When the application (or a part of it) is run, what actually happens? In this example diagram, a browser calls up a web server via the http protocol. The server application may call up an SQL database, or it may use data it already has (cached?) on the local disc and not use the database stage. This diagram helps you spot bottlenecks, and provides you with a route to finding what's happened if the application fails to run to completion.
The Deployment diagram. This shows you all the tools that you need, how you go from test and development system through to pre-production systems, the live system, and on to backups. It will include things like the source code control system that you use, and provide you with an indication of how you can roll back if something goes wrong, and an assurance that (if you follow the diagrams) that you really do have a backup of everything so that you can roll back.
State diagrams. For each type of object - what creates it, and what happens when it's finished with. And what happens in between. If calculations are done, is that as the object is set up, or as the results are needed? Are results cached? ... for more complex objects (such as sessions in a shopping cart), what's the page the object owner - shopper - is currently on?
Procedural diagrams. Also known as "flow charts" ;-) ... a diagram of the operation of each method. Procedural diagrams can be converted to actual code on some of the more sophisticated UML tools.
When you're learning Object Oriented Programming, you really need to learn the syntax and principles of the language elements, and also how to design to make best use of those elements. These diagrams - informally or formally - provide you help with the design.
 The Use Case diagram. "Where does the data come from, where does it go, and who provides it / who requires the answers". Where "who" is a job role, rather than an individual's name. The application that I started to write is indicated by the red arrow - taking the log files and providing a management / decision helping report.
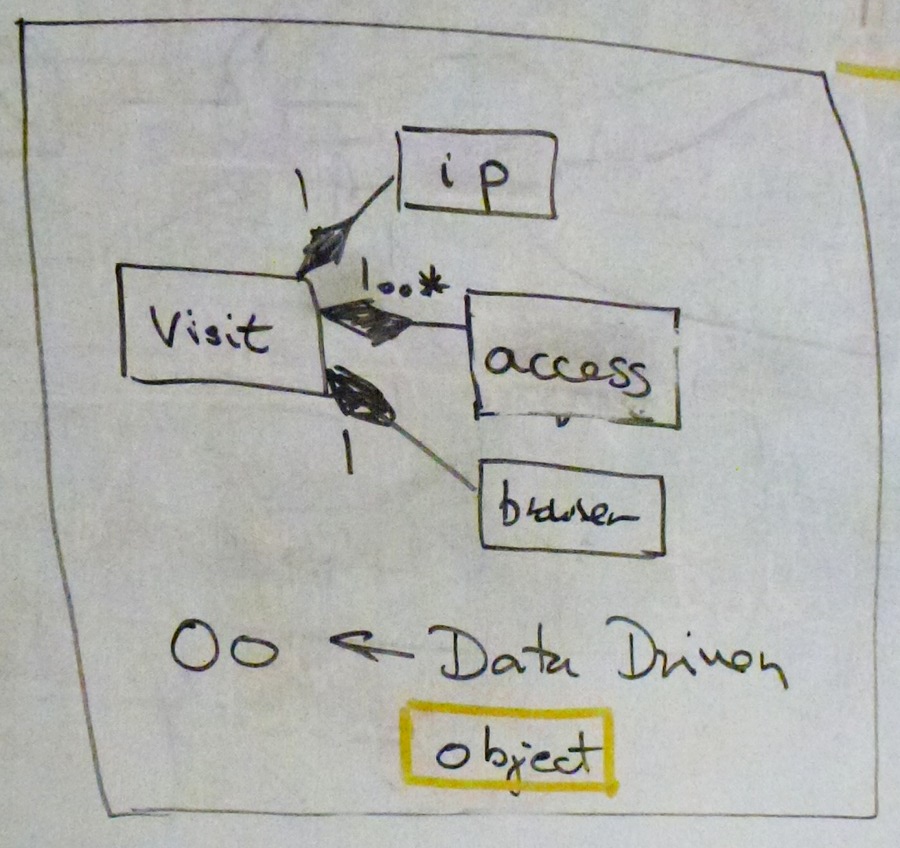 The Object diagrams. For each of the data types (objects), we're defining what they contain - what other objects, how many of them, etc. In this example, we're defining a "visit" as containing one or more "requests". Each visit will contain one "browser" object and one "ip" object.
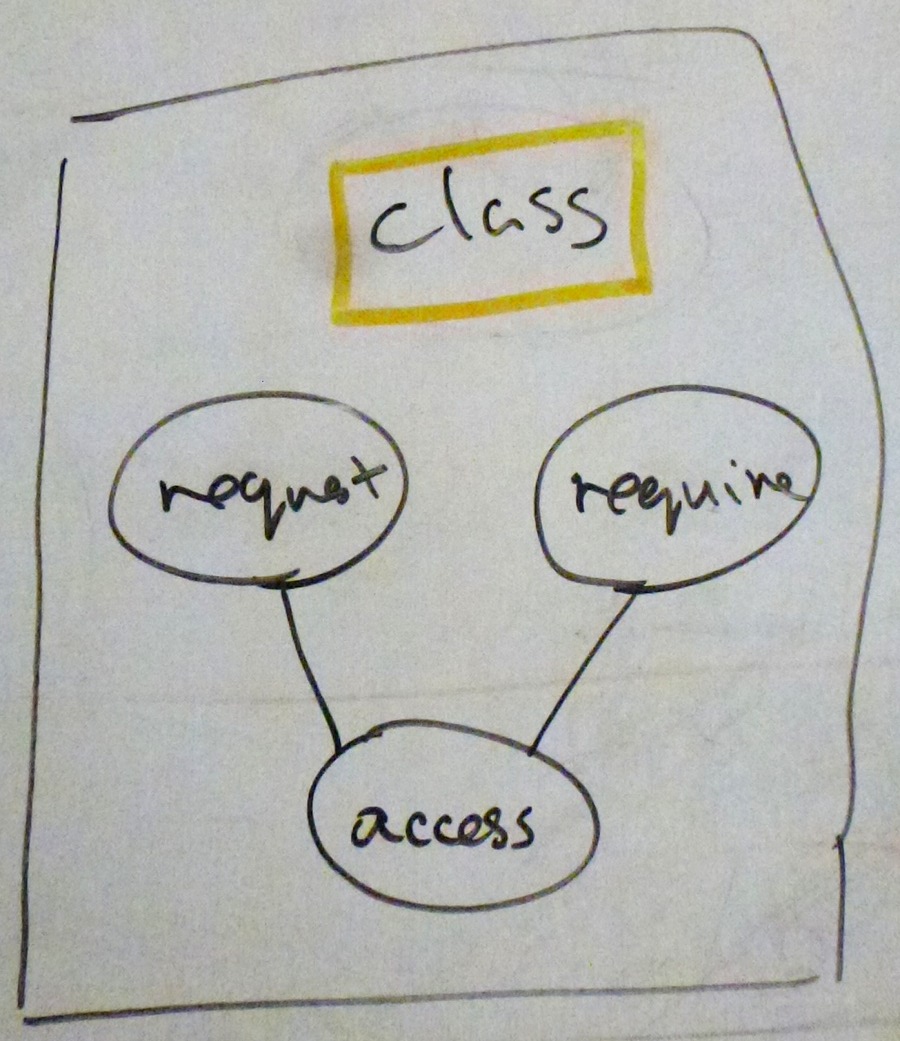 Class diagrams. Where data types have subclasses / other subsidiary types, you'll need to work out your inheritance tree. In this example, website access requests within a visit are divided into "request" objects which are specifically requested by a visiting user, and "require" objects which are called up within a page by a request - that's accesses for things like style sheets and embedded images.
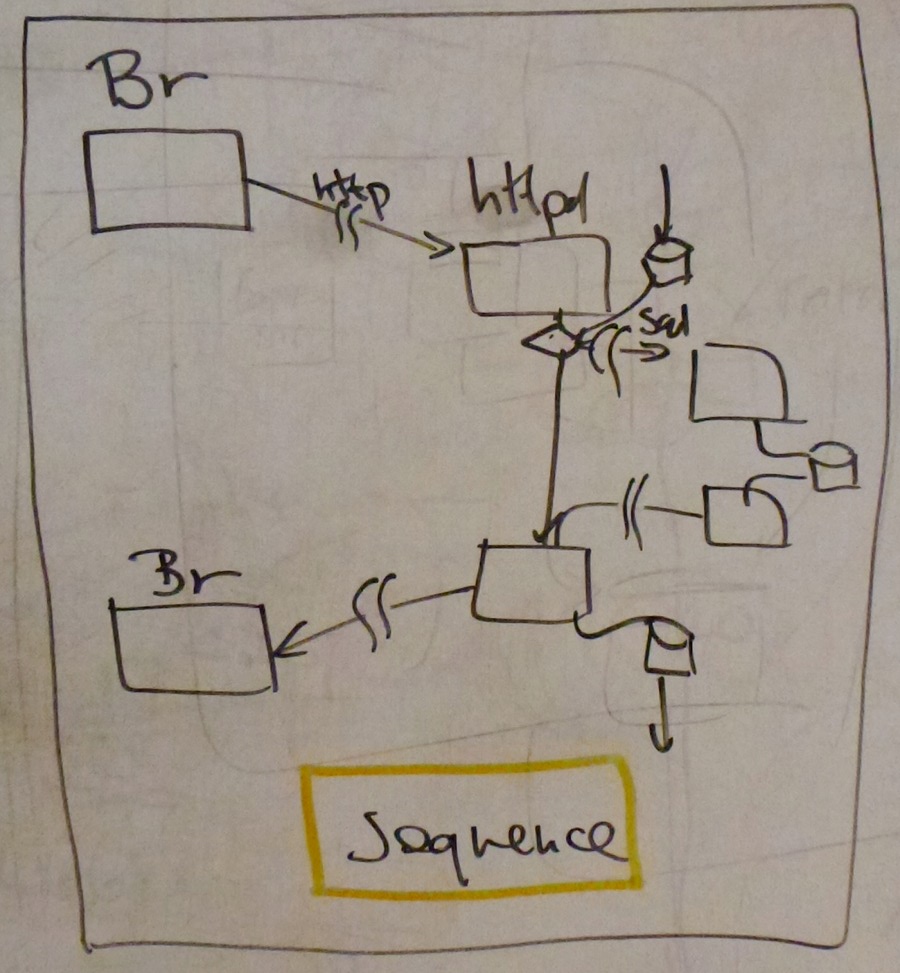 Sequence diagrams. When the application (or a part of it) is run, what actually happens? In this example diagram, a browser calls up a web server via the http protocol. The server application may call up an SQL database, or it may use data it already has (cached?) on the local disc and not use the database stage. This diagram helps you spot bottlenecks, and provides you with a route to finding what's happened if the application fails to run to completion.
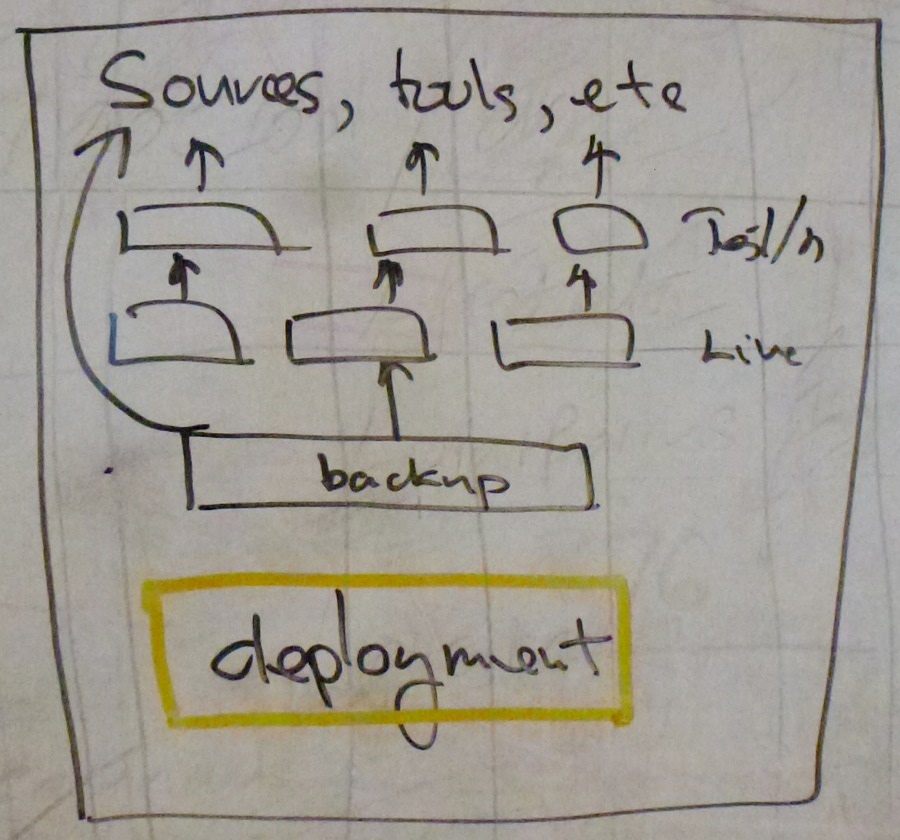 The Deployment diagram. This shows you all the tools that you need, how you go from test and development system through to pre-production systems, the live system, and on to backups. It will include things like the source code control system that you use, and provide you with an indication of how you can roll back if something goes wrong, and an assurance that (if you follow the diagrams) that you really do have a backup of everything so that you can roll back.
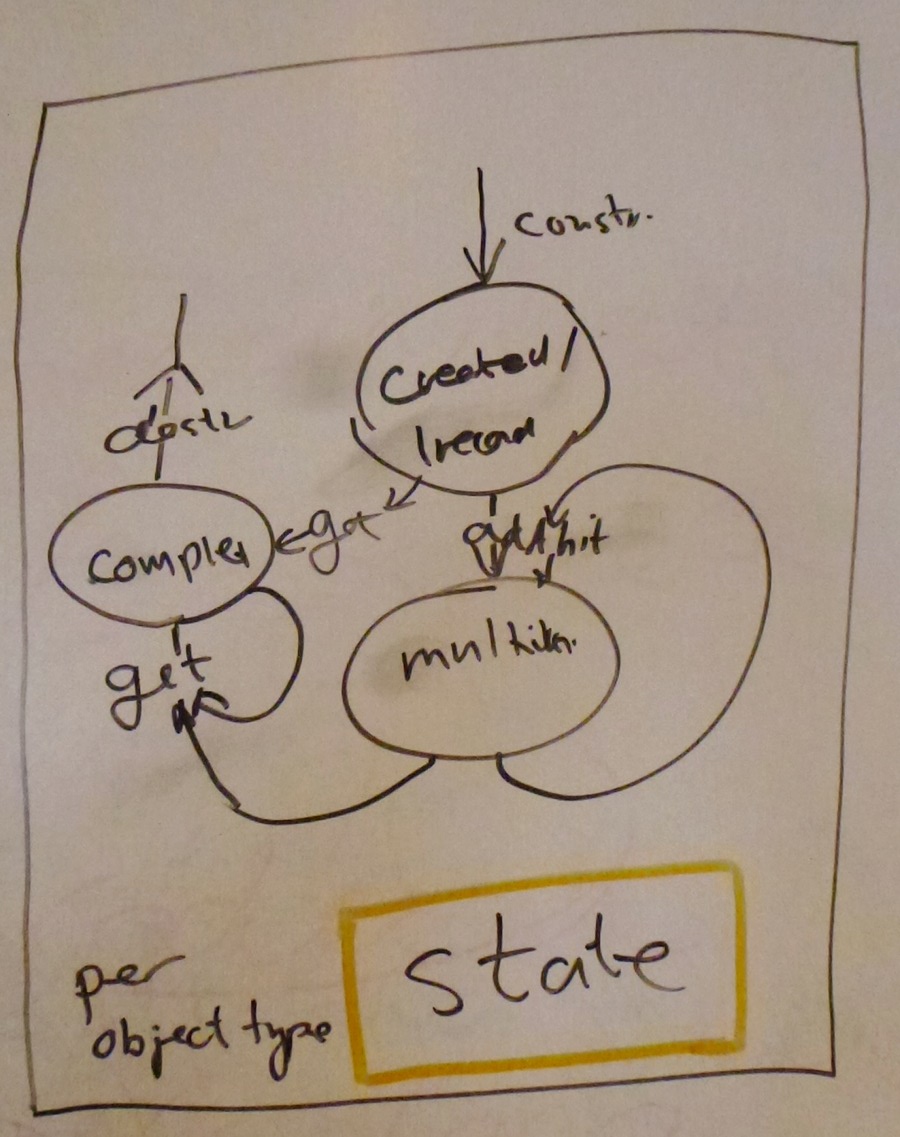 State diagrams. For each type of object - what creates it, and what happens when it's finished with. And what happens in between. If calculations are done, is that as the object is set up, or as the results are needed? Are results cached? ... for more complex objects (such as sessions in a shopping cart), what's the page the object owner - shopper - is currently on?
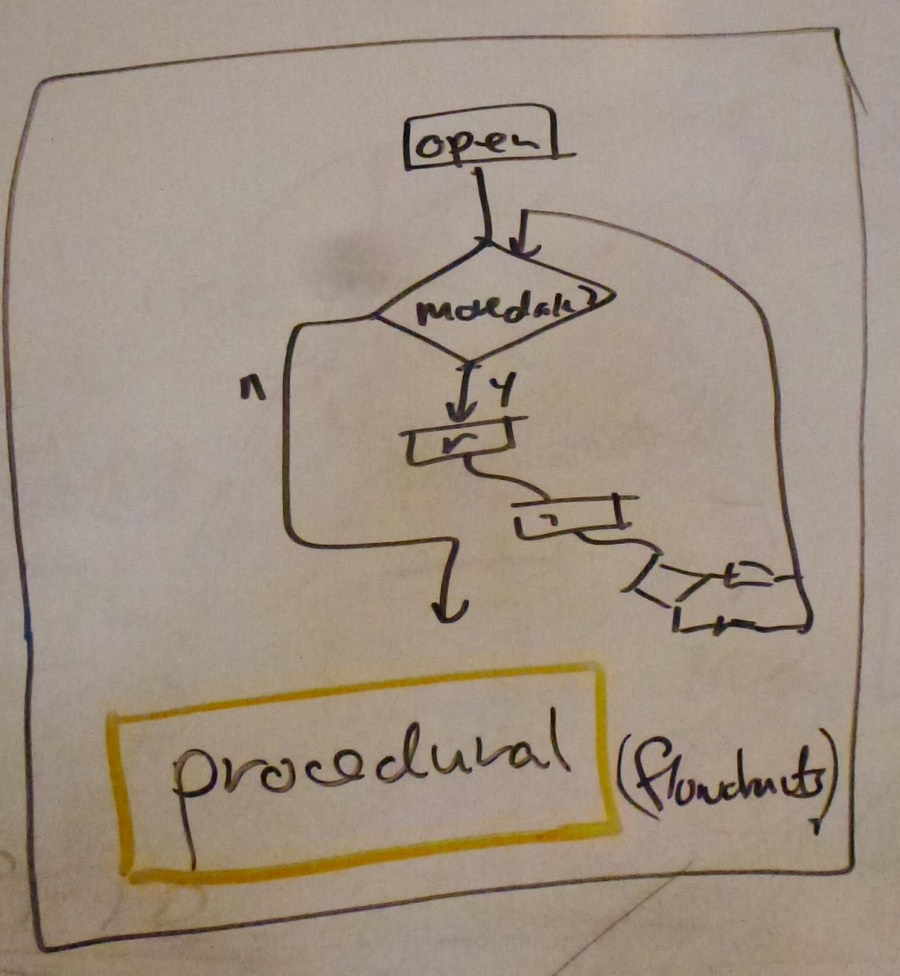 Procedural diagrams. Also known as "flow charts" ;-) ... a diagram of the operation of each method. Procedural diagrams can be converted to actual code on some of the more sophisticated UML tools.