Apache httpd Server Status - monitoring your server
Archive - Originally posted on "The Horse's Mouth" - 2010-10-28 07:44:00 - Graham EllisDo you want to know how your Apache httpd web server is running? The Server Status tool - a standard module supplied with the httpd daemon - can give you a lot of information, but by default it's turned off.
Turning it on ...
A work of caution before you turn it on. You do NOT want this to be world visible, so you'll want to limit the access.
1. In httpd.conf, remove the comment (#) in front of the httpd-info.conf line:
Include conf/extra/httpd-info.conf2. In extra/httpd-info.conf, remove comments (#) in front of the server status lines AND SET UP YOUR OWN DENY RULES:
<Location /server-status>

  SetHandler server-status

  Order deny,allow

  Deny from all

  Allow from 94.169.96.118 82.46.84.213 83.170 127.0.0.1

</Location>
The IP addresses listed are our specific client (browsing) locations, and the server itself, which responds in our case to several IP addressed in the 83.170 range; the server itself needs to get the report for its regular logging via scripts such as the one supplied (very old) with httpd sources, or [this one].
3. Having limited where the data can be seen from, you can turn full status reports on:
ExtendedStatus OnUsing it
1. By default, you get a full report when you visit the URL that you've set up above
2. You many add ?refresh=nn to the URL, where "nn" is the number of seconds between reports, and it will the autorefresh
3. As an alternative, you may add ?auto to the URL, in which case you'll gt a shortened report in an easier format for automated tools to use.
Reading the result
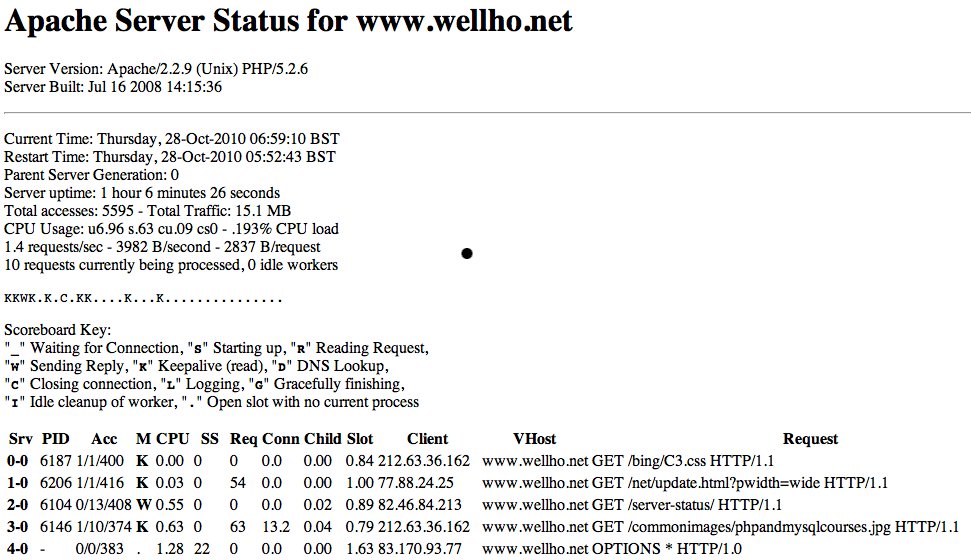 Here's a snapshot of our live server ... at a very quiet time. I had restarted it (part of the cleanups and work I was doing to write this series of articles) and hour previously, and there had been 5595 requests in that time. The processor was pretty close to being idle (but, beware, this is only the Apache usage, not the cpu as a whole) and the total traffic had only been about 15 Mbytes.
One process had completed and was being closed
One process was actually sending a reply (the read having been completed)
Eight processes had completed, but were being kept alive in case of other requests from the same client
and there were 25 open slots
Looking at the process by process report, you can see the details of the most recent request on each slot (the active one in the case of the working process). You'll notice a strange OPTIONS line on slot 4 ... that's standard in Apache 2.2 and it's how the server tells its own processes to neatly close out. If you're watching a server log file with tail -f and it goes quiet, you'll see a whole bunch of these pop up.
Much of the further information about each slot is cumulative since the process in it was started; it does not relate to just the current or most recent use.